

Earlier this week I collected some reaction timer data on my Pi using the BBC micro:bit as an input device. I only produced an “ASCII art” chart at the time:
      times←ReactionTimer.Play
      times
251 305 294 415 338 298 294 251 378
      ReactionTimer.AsciiChart times
425|
400|    *
375|         *
350+
325|     *
300|  *
275|   *  **
250+ *      *
Retro is back in style – but of course I should point out that we can produce “proper” graphics using SharpPlot, a cross-platform graphics package that is included with Dyalog APL on all platforms. I’ve enhanced the ReactionTimer namespace with a function called SPHistogram. If you are using RIDE as the front end to APL on the Pi, this will render output from SharpPlot in a window:
ReactionTimer.SPHistogram times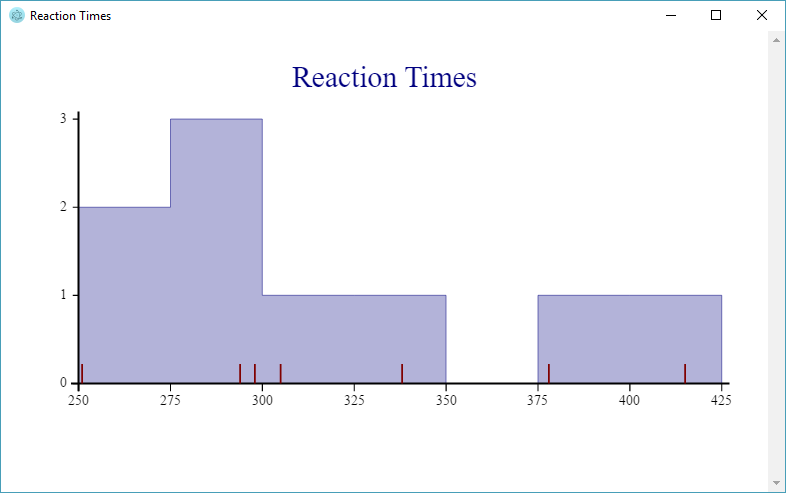
The original ASCII chart simply plotted the observations in the order that they occurred. Above, the shaded areas show how many observations there were in each bucket (2 between 250ms and 275ms, 3 between 275ms and 300ms, and so on). At the same time, the individual observations can be seen along the X axis as vertical red lines. It is a little unfortunate that, presumably due to some artifact of the timing process, the values 251 and 294 occur twice – and these lines are drawn on top of each other.
The example highlights one of the things that makes SharpPlot a bit special: We have overlaid a histogram showing the frequency of reactions in each bucket, and used a “scatterplot” to where the Y value is always 0, to mark the individual observations along the X axis.
     ∇ SPHistogram times;heading;renderHtml;sp;svg;z
[1]   heading←'Reaction Times'
[2]   renderHtml←3500⌶ ⍝ Render HTML in Window
[3]
[4]   :If 0=⎕NC'#.SharpPlot' ⋄ #.⎕CY'sharpplot.dws' ⋄ :EndIf
[5]
[6]   sp←⎕NEW #.SharpPlot(432 250)
[7]   sp.Heading←heading
[8]
[9]   ⍝ Draw histogram
[10]  sp.ClassInterval←25
[11]  sp.SetXTickMarks 25
[12]  sp.HistogramStyle←#.HistogramStyles.SurfaceShading
[13]  sp.SetFillStyles #.FillStyle.Opacity30
[14]  sp.DrawHistogram⊂times
[15]
[16]  ⍝ Add observations using ScatterPlot
[17]  sp.SetMarkers #.Marker.UpTick
[18]  sp.SetPenWidths 1
[19]  sp.SetMarkerScales 3
[20]  sp.DrawScatterPlot(times×0)(times)
[21]
[22]  ⍝ Render SVG and display in window
[23]  svg←sp.RenderSvg #.SvgMode.FixedAspect
[24]  z←heading renderHtml svg
     ∇
Hopefully the code is more or less self-explanatory, but if you’d like to learn more about SharpPlot there is excellent documentation at http://sharpplot.com. The documentation is actually written for C# users, but there is an illustration of how to translate the documentation to APL (and VB) at http://www.sharpplot.com/Languages.htm.
 Follow