

Today, the UK is holding elections for local councillors in England, and members of the devolved parliaments in Scotland and Wales. Until a political party starts pushing for mandatory APL lessons, we’re not interested in the results of these elections for this blog post. What we are interested in is algorithms, and, for the first time, the elections to the Welsh Parliament (usually referred to as the Welsh ‘Senedd’) used the D’Hondt method for allocating seats.
The D’Hondt method is named after Belgian mathematician and lawyer Victor D’Hondt, although it was independently invented by United States Founding Father Thomas Jefferson almost a century earlier! The method transforms a vote count for a number of political parties into an approximately proportional allocation of seats to each of the parties. Therefore, unlike in previous Senedd elections, Welsh voters do not have individual representatives on their ballots. Instead, they each vote for one political party. The parties then send as many representatives to the Senedd as they are allocated by the D’Hondt method.
With the D’Hondt method, seats are allocated to parties one-by-one. When each seat is allocated, it is given to the party with the largest vote count relative to the number of seats they have already been given. This way, more popular parties are given seats first, but when they have several already, a seat goes to a smaller party so that it is also represented.
This means that, when allocating a seat, the ‘quotient’ votes÷(seats+1) is calculated for each party, where votes is the number of votes the party received, and seats is the number of seats they have been allocated so far. The +1 is included to avoid division by zero. The party with the largest quotient is allocated the seat, and the process is repeated until all seats have been allocated.
Let’s implement this in APL. Given a vector votes and a vector seats, with each index corresponding to a political party, the index of the party with the greatest quotient can be found as follows:
i←⊃⍒votes÷seats+1The grade down of the quotient returns the indices to sort the quotients in descending order. Therefore, the first of these indices will be the index of the greatest quotient – exactly what the algorithm calls for.
We then need to update seats to give a seat to this lucky party. There’s more than one way to do this, but I’ll take a functional approach and use the at operator (@) to add 1 ‘at’ the index of party i:
1(+@i)seatsThis can be wrapped in a dfn, in which ⍺ is the votes vector and ⍵ is the current seat allocation.
      Step←{
          i←⊃⍒⍺÷⍵+1
          1(+@i)⍵
      }
To allocate, say, fifty seats, the Step function should be applied 50 times on successive seat allocations – an ideal use-case for the power operator (⍣). Let’s try it with a hypothetical vote share of 4:3:2 for three parties:
      4000 3000 2000 (Step⍣50) 0 0 0
22 17 11
That’s a ratio of around 4:3.1:2 – a good approximation of the original vote-share!
It’s easier to visualise the behaviour of the D’Hondt method over time by considering just two parties. Let’s call them Party A and Party B. Suppose that these parties received 12,345 and 6,789 votes respectively, and share a 50 seat parliament.
      12345 6789 (Step⍣50) 0 0
32 18
Party A is allocated 32 seats, while party B is allocated 18. This ratio is, again, reasonably close to that of the votes:
      12345÷6789  ⍝ vote ratio
1.818382678
      32÷18       ⍝ seat ratio
1.777777778
Let’s see how this ratio changes with each step. By modifying the Step function, we can record the intermediate seat allocations. ⍵ is now a matrix with a row for the seat allocation after each step. The most recent allocation is extracted with ⊢⌿, which is an idiom for the last row of a matrix. The function must now be called with an initial value of [0 0⋄], which is a one-row matrix of two zeros expressed using array notation.
      Step←{
          seats←⊢⌿⍵
          i←⊃⍒⍺÷seats+1
          ⍵⍪1(+@i)seats
      }
      12345 6789 (Step⍣50) [0 0⋄]
 0  0
 1  0
 1  1
 2  1
 3  1
 3  2
 4  2
 5  2
...
We can now plot the ratio (the ÷/ of this result matrix, on the vertical axis) against the step of the method (on the horizontal axis). The ratio after each step is drawn as an orange dot, and the perfect ratio which the method is approaching is drawn by the lavender line.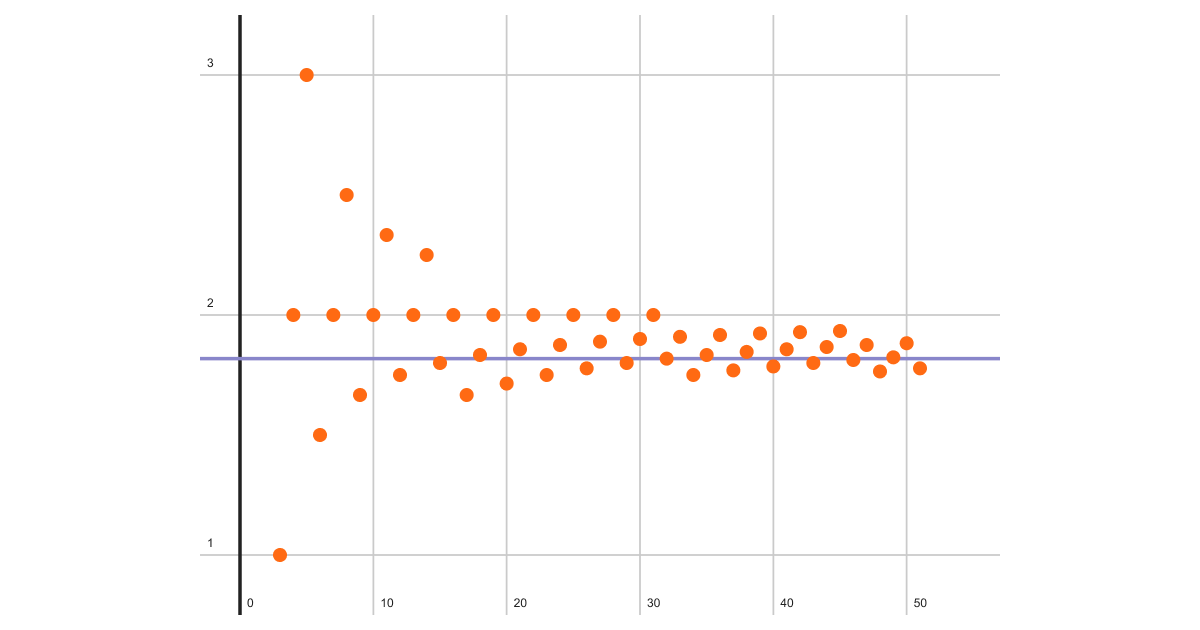
We can see the ratio converging to the ratio of the votes. The really interesting question is why. I won’t give a formal proof here, that’s one for mathematicians and political scientists to write about. I will, however, show you how I understand it.
It’s interesting to look at a plot of the seat allocation given by the D’Hondt method alongside a ‘perfect’ allocation where we are allowed fractional seats. The vertical axis corresponds to seats allocated to party A, and the horizontal axis corresponds to seats allocated to party B. The trace of seat allocations is drawn as an orange line in the shape of a staircase, and the line of perfect allocation is drawn as a straight lavender line.
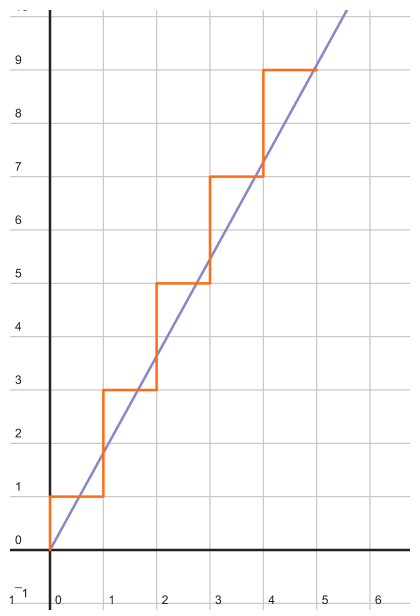
At each step, the D’Hondt method (usually) moves towards, and subsequently crosses, the line of perfect allocation. When an allocation is above the line, Party A has ‘too many’ seats, giving it a smaller quotient. The method then allocates a seat to Party B to correct for this, corresponding to the rightward move on the plot. The opposite also applies – when the allocation is below the line, Party B has the smaller quotient, and the method moves the allocation vertically.
There are exceptions to this pattern – cases where the allocation moves away from the line of perfect allocation. This is because of the “fudge factor” +1 on the seat count. This imaginary extra seat for each party can skew the allocation decision occasionally. From my limited reading, it looks like this is a known behaviour of the D’Hondt method, and is deliberately retained.
By ‘hugging’ the perfect allocation like this, the D’Hondt method stays within a few seats of being perfectly proportional. As the number of seats increases, this error is relatively smaller, so the accuracy of the method increases.
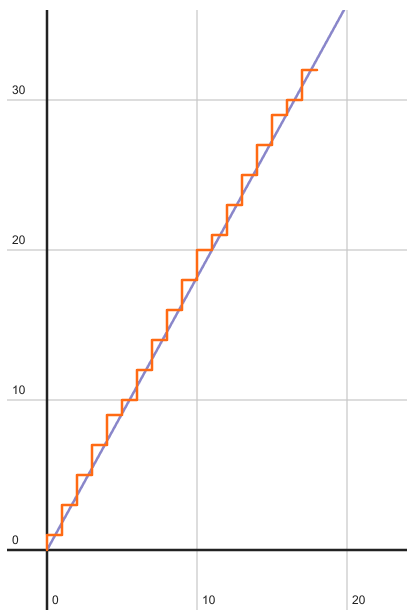
This is how the D’Hondt method allocates seats at a ratio close to the ratio of votes, and gets better as there are more seats available.
Irrespective of whether you’re Welsh, I hope it was interesting to explore the D’Hondt method for apportionment with APL!
 Follow
Nicely done. You should post this in the INFORMS analytics monthly online magazine
Thank you Ken!