

Sometimes I want an additional functionality in the IDE. (Are you a RIDE user? We’ll cover that too!) For example, the other day, I was tracing through some very long functions to find an error which was being caught by a trap. Since the error was being caught, I couldn’t just let the function run until it would suspend. Again and again, I would press too many times, causing the error to happen and be trapped, and thus having to start all over again.
I wish I could select a line and run until there, I thought. Sure, I could set a break-point there and then continue execution, but that would drop me into the session upon hitting the break-point, and then I’d have to trace back into the function, and remember to clear the break-point. A repetitive work-flow indeed.
Make it so!
Luckily, I know someone who loves doing repetitive tasks: ⎕PFKEY. This is what I needed done:
- Toggle break-point (to set it)
- Resume execution
- Trace
- Toggle break point (to clear it)
A quick look in Options > Configure… > Keyboard Shortcuts > Code revealed that the command codes for these are BP, RM, TC, and BP again, so I tried:
      'BP' 'RM' 'TC' 'BP' ⎕PFKEY 10
 BP  RM  TC  BP
I defined a simple function to test it with, and traced into that:
      ⎕FX 'f',⎕D
      ⎕VR 'f'
     ∇f
[1]   0
[2]   1
[3]   2
[4]   3
[5]   4
[6]   5
[7]   6
[8]   7
[9]   8
[10]  9
     ∇
      f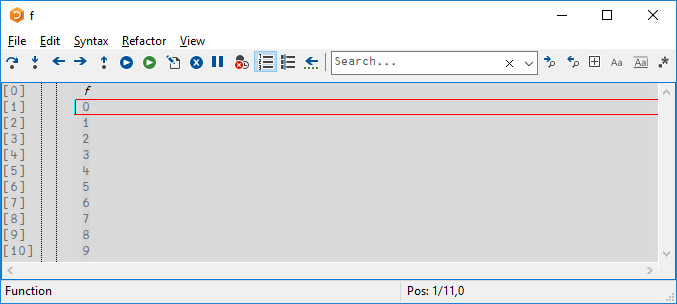
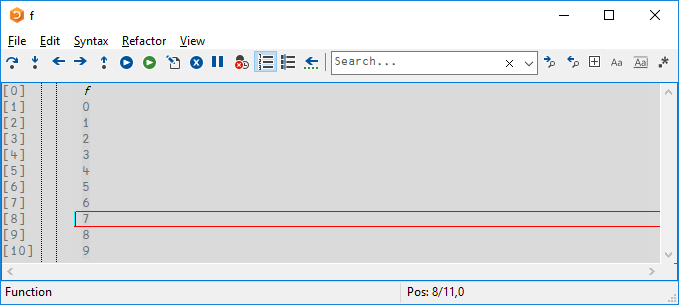
Then I clicked on the line with a 7 on it, pressed , and lo:
Keep it so!
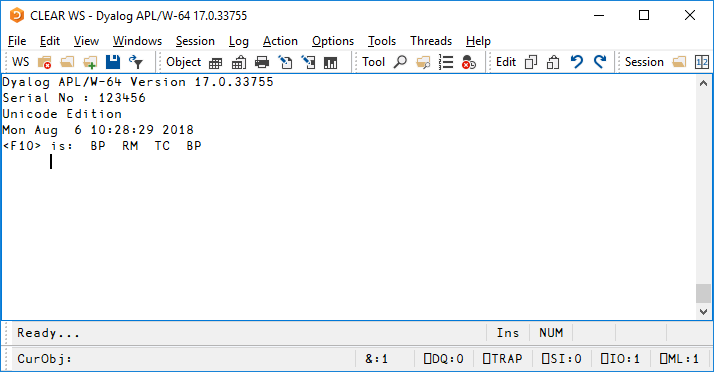
Of course, I wouldn’t want to be bothered with setting this up in every session. So here’s a trick to set up F-keys (or anything else for that matter). When Dyalog APL starts up, it will look for MyUCMDs\setup.dyalog in your Documents folder ($HOME/MyUCMDs/setup.dyalog on non-Windows). If this file contains a function named Setup, it will be run whenever APL starts:
      ∇Setup
[1]  '<F10> is: ','BP' 'RM' 'TC' 'BP' ⎕PFKEY 10
[2]  ∇
      (⊂⎕NR'Setup')⎕NPUT'C:\Users\Adam.DYALOG\Documents\MyUCMDs\setup.dyalog'
And now, when I start APL:
Cool, but how about the RIDE?
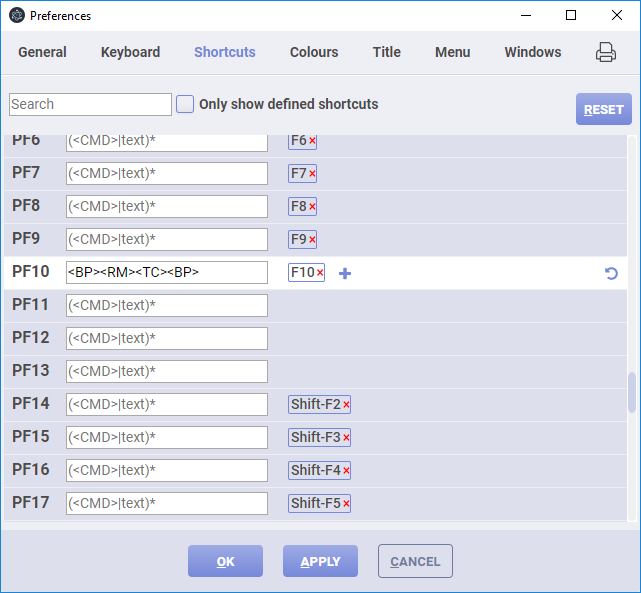
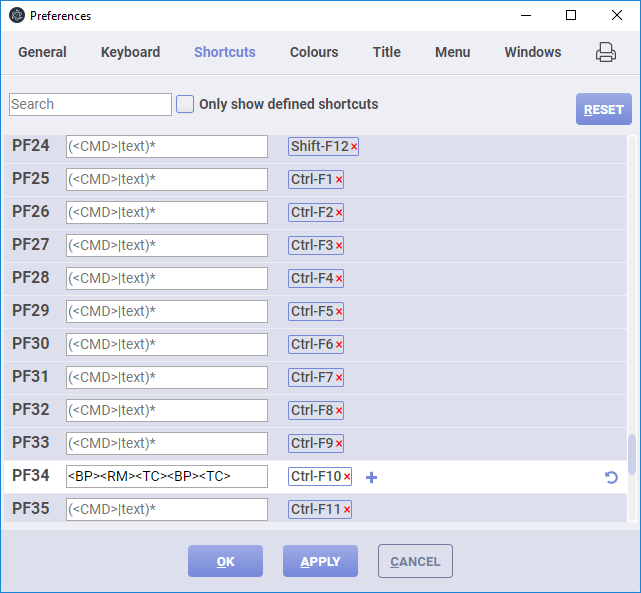
Right, the RIDE doesn’t support ⎕PFKEY. However, Edit > Preferences > Shortcuts lets you both find the relevant command codes and assign them to F-keys. Just put <BP><RM><TC><BP> (type or paste those sixteen characters, with angle brackets and everything — don’t press the keys they symbolise!) in the PF10 input field:
The RIDE saves these preferences for you. Note that you can’t assign F-keys in $HOME/MyUCMDs/setup.dyalog because ⎕PFKEY has no effect in the RIDE, but you can still use that file to initialise other things.
Taking it one step further…
After using this for a while, I realised that I often want to “step into” a specific line . That is, I found myself pressing and then – (the default keystroke for tracing). So I’ve assigned – the same sequence, but with an additional trailing TC action:
      ∇Setup
[1]  '<F10> is: ','BP' 'RM' 'TC' 'BP' ⎕PFKEY 10
[2]  '<Ctrl>+<F10> is: ','BP' 'RM' 'TC' 'BP' 'TC' ⎕PFKEY 34
[3]  ∇
      (⊂⎕NR'Setup')⎕NPUT'C:\Users\Adam.DYALOG\Documents\MyUCMDs\setup.dyalog'
And for the RIDE, I set PF34 (which by default is invoked with –) to <BP><RM><TC><BP><TC>:
 Follow
The ‘Toggle Breakpoint’ shortcut was good to learn about. Is there also a ‘Toggle Trace’ option, and how does the ‘Trace’ shortcut work?
No, but if you want one, let me know, and I’ll forward your request. is exactly as when you press Ctrl+Enter (that is, if you have not changed default keystrokes).