

Joint Statistical Meetings (JSM) is an annual conference hosted by the American Statistical Association. Last month, Josh, Martina, and I attended JSM 2025 in Nashville, Tennessee, with Professor Stephen Mansour. Josh, Martina, and I were exhibitors, and hosted a stall in the exposition hall alongside other organisations. Steve exhibited TamStat (a free-to-use statistical package written in Dyalog APL) alongside us, but was also an attendee and gave a presentation and a workshop at the conference.
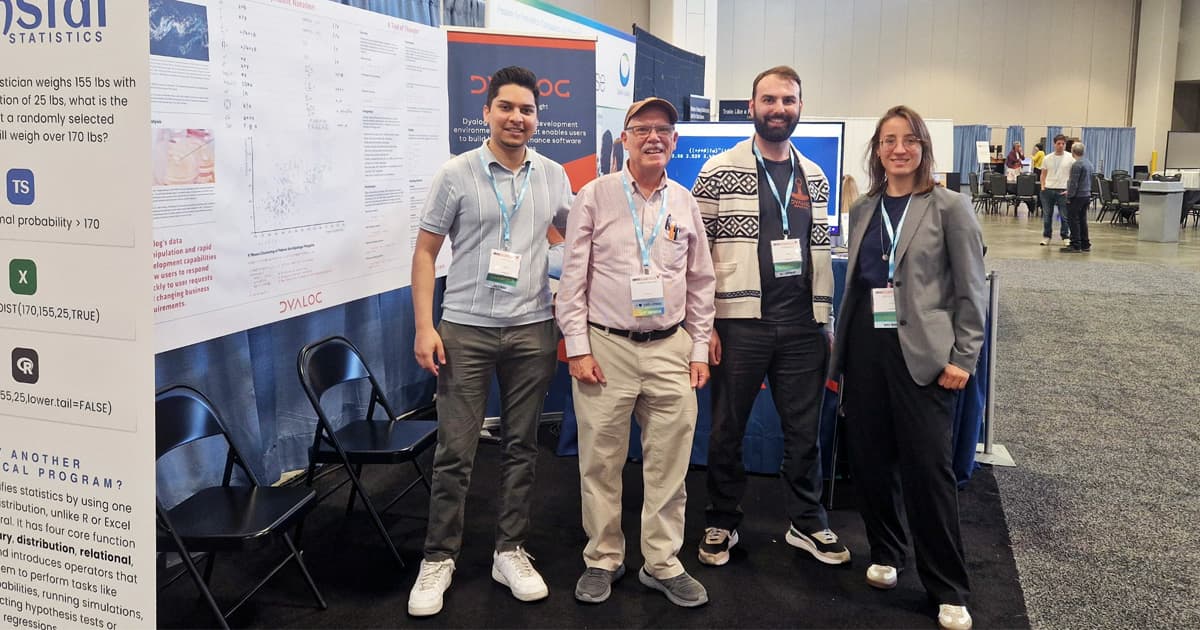
Josh, Stephen, Rich, and Martina at the Dyalog Ltd booth
Our large poster included TamStat as one of several use cases, a visual hook comparing APL with traditional mathematical notation, an example using APL to compute k-means clustering, and information about Dyalog features. It was designed to intrigue people from a distance and encourage them to come closer to read more details. The maths and clustering selected for the poster were chosen based on them being things that statisticians are already familiar with. One person said APL glyphs reminded them of Inuktitut syllabics.
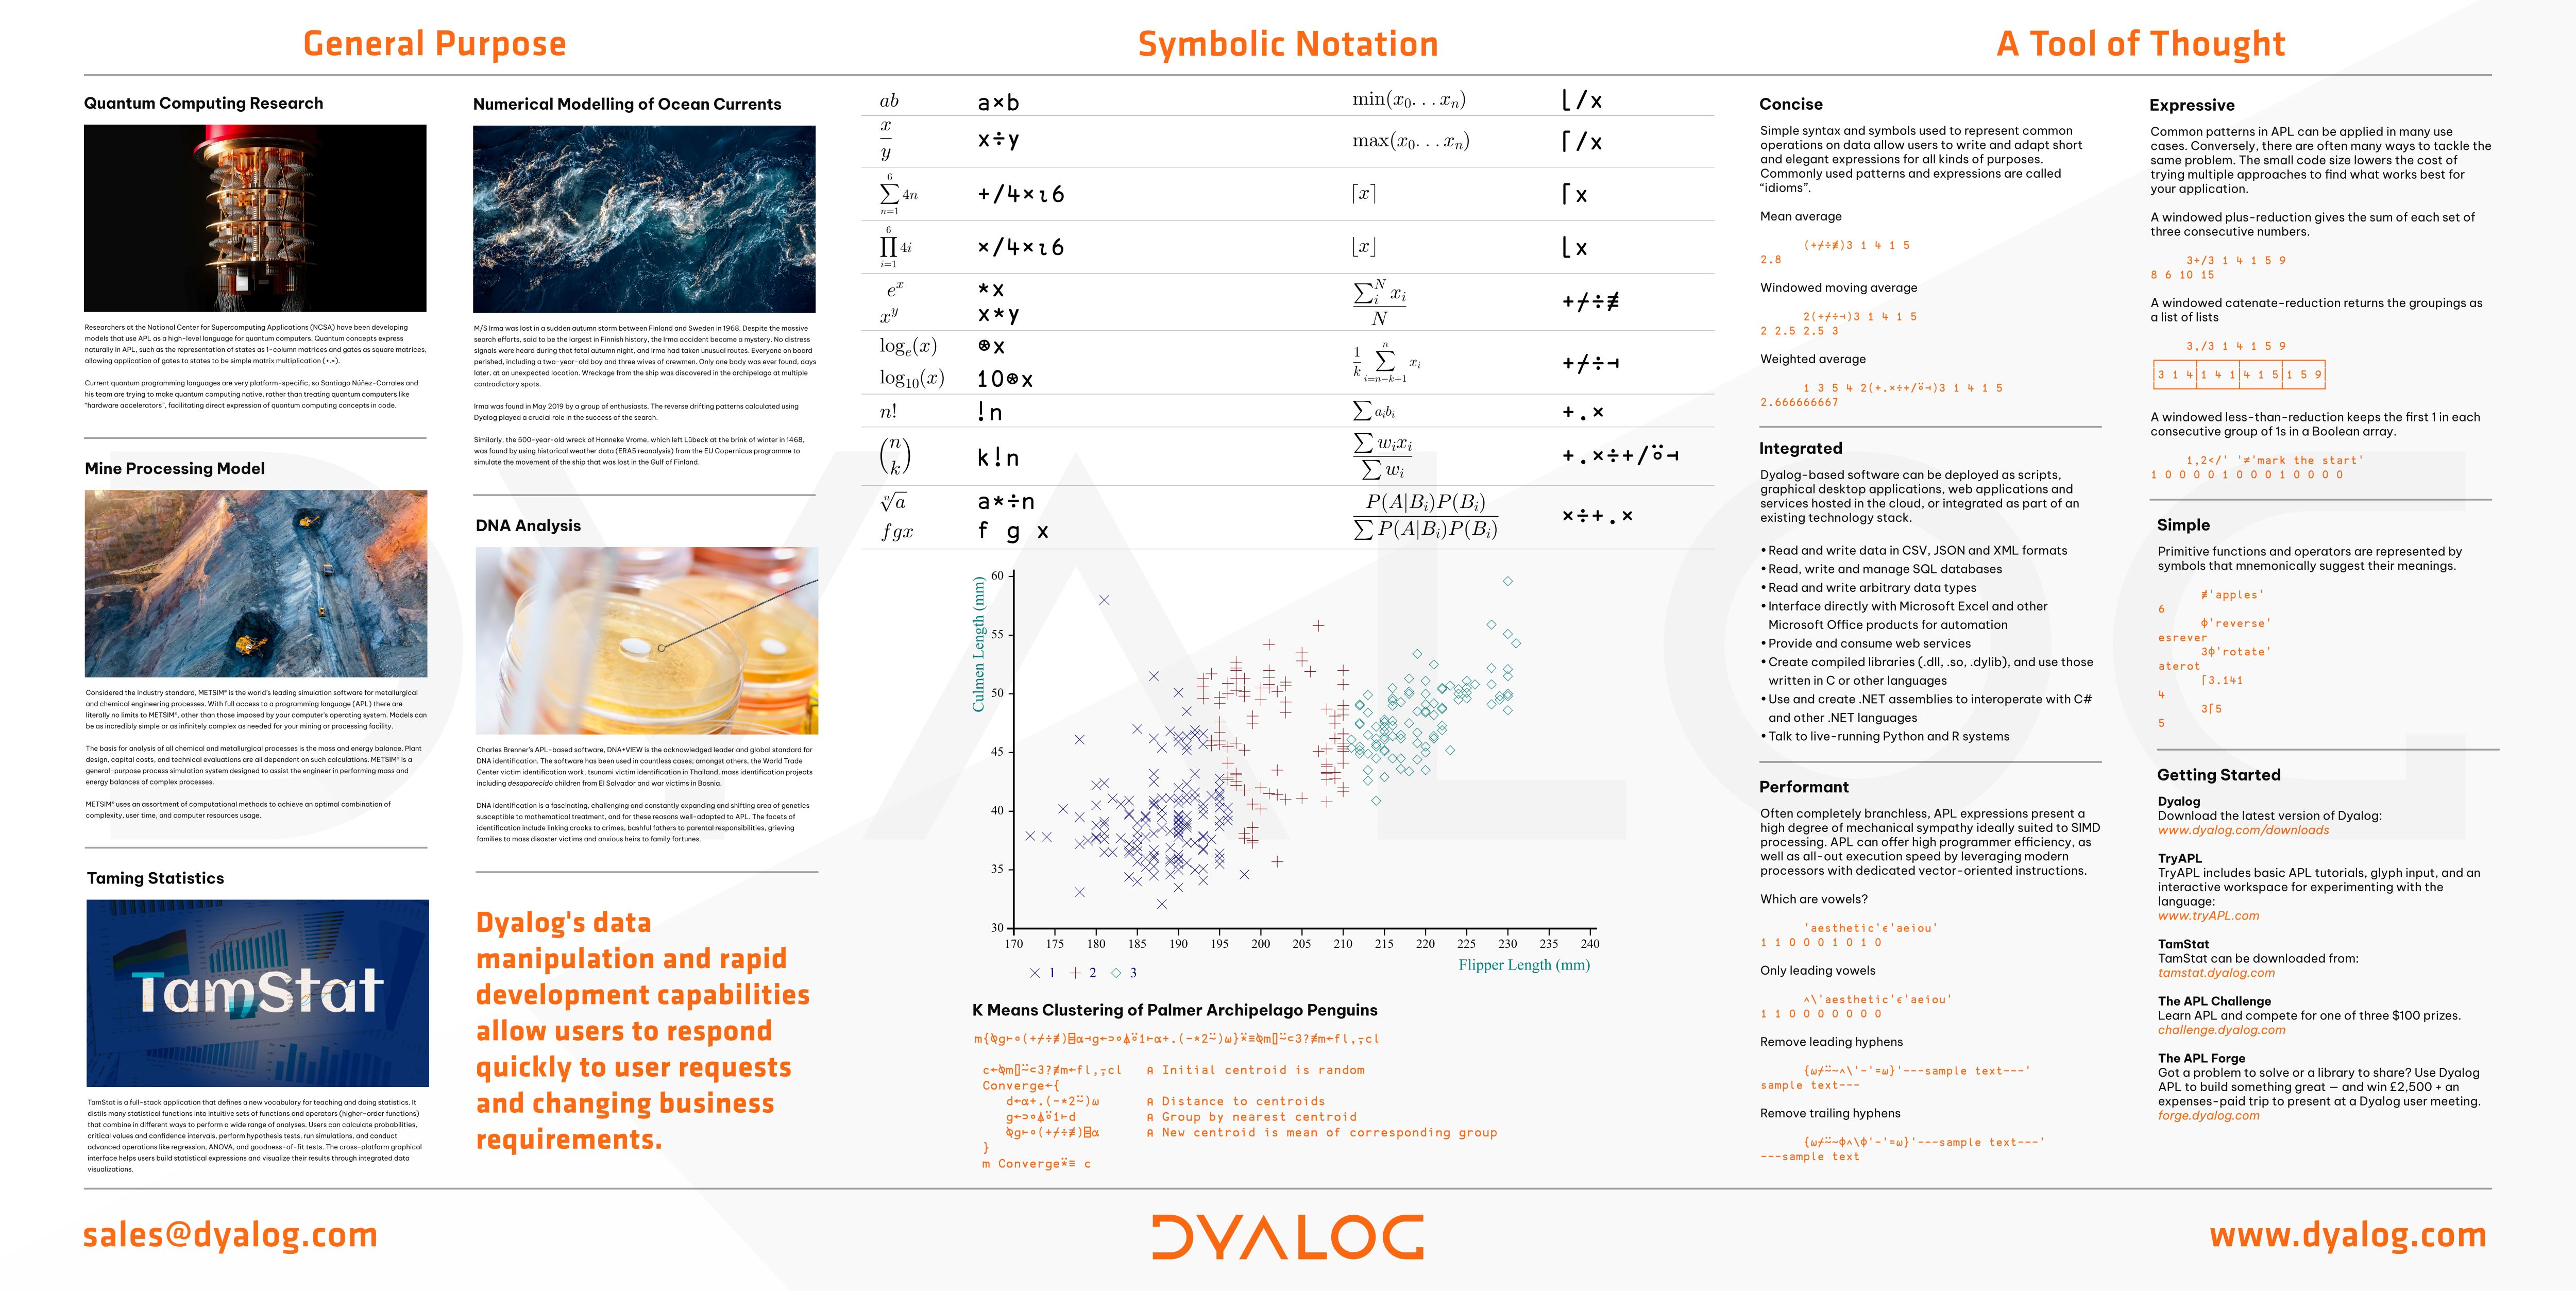
Promotional poster used at JSM 2025
TamStat attracted a lot of interest from both students and teachers. Students were impressed by its simplicity, and some teachers were looking for web browser-based applications because they are easy to access on their institutions’ systems. Steve has distilled core statistical concepts into a very digestible syntax and vocabulary that echoes APL. In his workshop, the students remarked how easily they were able to pick up the syntax and use the graphical interface to solve the exercises.
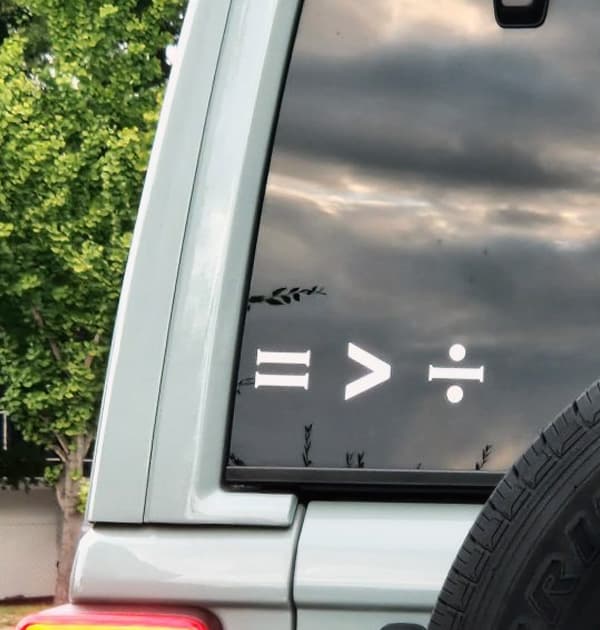
While driving around the city, we noticed this sticker on a car window. I’m not sure the driver knows that it’s valid APL! Can you tell what it means in English? Can you tell what it does in APL?
On the first night there was an informal event hosted in the exposition hall, including “speed posters” presentations on an array of computer monitors; presenters had only one hour to show their work (as opposed to the larger poster sessions that were a whole morning and afternoon). There was karaoke and refreshments, and exhibitors were in their booths for dicussions. People did come and talk to us, although that wasn’t the main purpose of the evening. Our highlight was seeing Steve’s incredible cover of Your Cheatin’ Heart by Hank Williams.
Twice a day there were large poster sessions where academics were available to explain their research. Many of these centred around assessing various statistical methods, machine learning, and some deep learning methods, especially for high dimensional (lots of parameters, not as in array axes) data or limited available data, and they were often in the context of supporting medical studies. Despite biostatistics being the plurality, there was a range of research on display including statistical methods applied to exoplanet detection (astrophysics), medical studies, and an adventure board game for teaching statistics. Many established statistical software packages were employed – most people used R, although we heard a few cases of Julia being used for heavy computation.
We met so many lovely people during our week in Nashville, and were happy to be able to introduce so many people to Dyalog, APL, and TamStat. We learned a lot about statisticians, their use cases, and their feelings about the software they use. It’s always great showing Dyalog outside the APL community, and even better in person!
————————————
For more information on TamStat, see:
- Dyalog ’15 – presentation U13
- Dyalog ’16 – presentation U12
- Dyalog ’18 – presentations D07 and U03
- Dyalog ’19 – presentations U04 and U05
- Dyalog ’21 – presentation U03
- Dyalog ’22 – presentation U12
- Dyalog ’23 – presentation D16
- Dyalog ’24 – presentation U04
 Follow