Displaying cross-references with SharpPlot

Requirements: Update SharpPlot to v3.37 from my.dyalog.com > Downloads > Tools & Interfaces > GUI Tools > SharpPlot

SharpPlot v3.37 introduces Network Maps as a new chart type, and we’re going to use it to display the output of the ]XRef user command, which displays cross-references between all kinds of APL names :

      ]XRef ⎕SE.Parser
             DDEEEFLLMMNNPPPPPPPPPPPQQSSSTUaaaabbbcdddddddfffiilmmmmmmnnnnnnppppqqqqrrrsssssssssstttttuvvvxx∆⍵⍺ 
             EeRnrOOSAOAsRrsssssssss.uwwwrPrrrr:alu.aaaeee.ei.fq.aeioo.adeop.Daa.1mq.et:eipqtwwww:aqwxp.an.C... 
             LlRd:RW.XDRwEo:.eeeeeee.oDTiaPgggg:d.t.tttQff.ax.:..smndd..awv..art..:..qb:t.lzr.imp:b.vtp.lc.u... 
             I.OT:CE.APGiFp:Pttttttt.t.atpE.psv:....aaau.i.tC.:..k.lei..:....tm...:....:..i.:.tao:l...e....t... 
             M.Rr:ER.ROStIa:a........e.bc.R.o.a:....:..o.n.ua.:....elf..:....as...:....:..t.:..ts:e...r....:... 
             I.0a:S..GS.cXg:r.Samnpu.s.lh.:.s.l:....:ASt.e.rs.:....n.i..:....:....:....:..P.:....:....C....:... 
             T..p:P..S:.h.a:s.wloarp.:.e..:...u:....:rwe.d.ee.:....:.e..:....:....:....:..a.:....:....a....:... 
             E...:A...:.e.t:e.ildrep.:....:...e:....:gD..:.s..:....:.r..:....:....:....:..r.:....:....s....:... 
             R...:C...:.s.e:..toigfe.:....:...s:....:u...:....:....:.s..:....:....:....:..m.:....:....e....:... 
             ....:E...:....:..cwfsir.:....:....:....:m...:....:....:....:....:....:....:..s.:....:....:....:... 
             ....:....:....:..hni.x..:....:....:....:e...:....:....:....:....:....:....:....:....:....:....:... 
             ....:....:....:...oe....:....:....:....:n...:....:....:....:....:....:....:....:....:....:....:... 
             ....:....:....:...sr....:....:....:....:t...:....:....:....:....:....:....:....:....:....:....:... 
             ....:....:....:...ps....:....:....:....:s...:....:....:....:....:....:....:....:....:....:....:... 
             ....:....:....:...a:....:....:....:....:....:....:....:....:....:....:....:....:....:....:....:... 
             ....:....:....:...c:....:....:....:....:....:....:....:....:....:....:....:....:....:....:....:... 
             ....:....:....:...e:....:....:....:....:....:....:....:....:....:....:....:....:....:....:....:... 
 [FNS]        - - - - : - - - - : - - - - : - - - - : - - - - : - - - - : - - - - : - - - - : - - - - : - - - - 
 Parse       G.GG○G G GGGG. . . : . ○F.G.G:○○○○○! . ○GGF.○. .○F ○ .○. . ○!○○○G○○! : .○○○○ F :○○○○○○ ○ : ○○.F! . 
 Propagate    ○ . . . : . . . . : . . G . : . .○. . : . . . . : . . .○. : . . . . : . . .○. ○○. . . . :○. . . . 
 Quotes       . . . . : . . . . : . ○ . . : . . . . : . . . .○: .○. . ○ : . . . . ○ . . . . ○ . . .○. : . . . . 
 Switch       . G . . : . . . . : . . G .G: . . . . : . ○ . . : . . . . : . . . . : ○ .○. . : . . . . :○. . . . 
 deQuote      . . . . : . . . . : . . . . : . . . . : . . . . :○○ . . . : . . . . : . . . . ○ . . . . : . . . . 
 fixCase      . . . . : . . . . : . . . . : . . . . : . . . . : . . . . : . . . . : . . . . : . . . . : . . .○. 
 if           . . . . : . . . . : . . . . : . . . . : . . . . : . . . . : . . . . : . . . . : . . . . : . . . . 
 init        G.G. G GGGGGGFGGGGGGGGG.F.GF :○. .○. ○ : . . ○○F F . ○ ○ ○○: . .G. . : . . . .F: . . . . F . GF. . 
 splitParms   . . . . : . . . . : . ○ . . : . . .○.○: . . . . : . . . ○ : .○○ ○ ○○:○. .○. . : . .○. .○: . . . . 
 sqz          . . . . : . . . . : . . . . : . .○. . : . . . . : . . . . : . . . . : . .○. . : . . . . : . . .○. 
 upperCase    . . .G. : . . . . : . . . . G . .○. . : . . . .○: . . . . : . . . . : . .○. . : . . . . : . . .○. 
 xCut         . . . . : . . . . : . . . . : . . . . : . . . . : . . . . : . . . . : . . . . : . . . . : . . .○○ 

We can capture the output of the user command by doing either
]mat←XRef ⎕SE.Parser (from session)
or
mat←⎕SE.UCMD']XRef ⎕SE.Parser' (from code)

Until Dyalog v16.0 (which has ]XRef -raw), we need to parse the output of ]XRef to get a square link matrix, along with the full list of nodes (in row/column order of the matrix) and list of original rows (functions).

    ∇ (mat nodes rows)←GetMatrix mat;nodelabs;rows;cols;labs;cat;diag
      (rows mat)←2↑(1,2</∧⌿mat=' ')⊂[2]mat        ⍝ cut at empty column
      (cols mat)←2↑(1,2<⌿∧/mat∊' -:')⊂[1]mat      ⍝ cut at - - - - : - - - -
      mat←1↓[1](' '∨.≠mat)/mat                    ⍝ trim first row and empty columns
      rows←~∘' '¨↓(-1⊃⍴mat)↑[1]rows               ⍝ row titles (list of strings)
      cols←~∘' .:'¨↓(-2⊃⍴mat)↑[1]⍉cols            ⍝ col titles (list of strings)
      nodes←rows∪cols                             ⍝ all titles
      mat←((mat,' ')⍪' ')[rows⍳nodes;cols⍳nodes]  ⍝ square matrix of nodes
    ∇

Now let’s wrap the SharpPlot initialisation into a single function that uses the .NET version if available and falls back to the cross-platform APL workspace if not:

    ∇ {dotnet}←Init
      :If dotnet←(,'W')≡3⊃'.'⎕WG'APLVersion'
          ⍝ .Net assembly (windows only)
          ⎕USING←',sharpplot.dll' ',system.drawing.dll'
      :Else
          ⍝ APL workspace (all platforms)
          :If 0=⎕NC'Causeway'   ⍝ copy workspace only once
              (System.Drawing←System←⍎'Causeway'⎕NS'').(⎕CY'sharpplot.dws')
          :EndIf 
      :EndIf
    ∇

Then we can write a platform-independent function that returns the SharpPlot instance with the chart drawn on it. We split nodes into two categories, functions and globals (ignoring locals and labels) and split links by destination node. By default, DrawNetworkMap lays out node categories on co-centric circles. Also, because the graph is uni-directional, we can afford to use straight links without damaging readability:

    ∇ sp←name Plot(mat nodes rows);catlabs;nodecat
      sp←⎕NEW Causeway.SharpPlot
     
      catlabs←'Function' 'Global'    ⍝ links are split by destination node
      nodecat←(≢nodes)⍴0             ⍝ ignored by default
      ((∨⌿mat∊'FR*')/nodecat)←1      ⍝ functions
      ((∨⌿mat∊'G')/nodecat)←2        ⍝ globals
      ((nodes∊rows)/nodecat)←1       ⍝ caller functions
     
      sp.Heading←name
      sp.HeadingStyle←Causeway.HeadingStyles.Left
      sp.SetMargins 40 30 30 30
      sp.KeyStyle←Causeway.KeyStyles.(BottomAlign+RightAlign)
      sp.SetILabels⊂nodes
      sp.SetILabelFont'Arial' 6 System.Drawing.FontStyle.Bold System.Drawing.Color.Black
      sp.SetColors⊂System.Drawing.Color.(SkyBlue LightCoral)
      sp.SetMarkers Causeway.Marker.Ball
      sp.SetMarkerScales 2
      sp.SetLineStyles Causeway.LineStyle.Solid
      sp.SetPenWidths 0.5
      sp.NetworkMapStyle←Causeway.NetworkMapStyles.(SplitByDestination+Dissected+ArrowLines+FixedArcs+NoAxes+NoLinkKey)
      sp.SetNetworkMapLinkArc 0         ⍝ straight lines
      sp.SetArrowStyle 5                ⍝ fixed-size arrows
     
      sp.SplitBy nodecat catlabs
      sp.DrawNetworkMap⊂↓(mat∊'GFR*')   ⍝ use a single width for all valid links
    ∇

We can then save the graph as SVG to a file (here we use the SvgMode that scales the SVG to fit its container):
sp.SaveSvg 'XRef.svg' Causeway.SvgMode.FixedAspect

Or, if feeding a web server or renderer, we can grab the SVG as a single string without writing to disk:
svg←sp.RenderSvg Causeway.SvgMode.FixedAspect

Windows users will be able to use the SharpPlot Viewer:
vw←⎕NEW Causeway.SharpPlotViewer sp
vw.Show ⍬

XRef

More examples of Network Maps can be found on the SharpPlot.com website in the Network Map Tutorials. To translate C# examples into APL, you can refer to the SharpPlot Rosetta Stone.

Over the Moon with Selenium

Over the years, I have become more and more reluctant to write code without good regression tests – 35 years of software development have taught me that it is just too dangerous! Regression testing of user interfaces has always been difficult, but for the last few weeks I have been working with technologies that put user interface testing within easy reach: HTML and the Selenium WebDriver, which star in the following video (if you can wait, read the full story below the video before watching):

This is exciting – I hope you can see why I am “over the moon” (apart from Selene being the Greek Moon Goddess).

Modern Markup Languages

One of the good things about modern User Interfaces based on markup languages like HTML is that logical information about the user interface is available at runtime. For example, a browser displaying HTML maintains a “Document Object Model” of the web page. The content and other attributes of each element within the DOM can be inspected and manipulated at runtime by a testing tool – this is what Selenium does.

Selenium

Selenium is a widely used open-source tool for automating browsers, with growing support from browser vendors. Selenium provides an API that allows you to perform just about any operation that a user could: click on buttons and select items from drop-downs, press keys to enter text, drag and drop items, or perform exact mouse movements and different types of clicks. Over the last few weeks, we have been working on a some thin covers for Selenium to make it easy to drive browsers from Dyalog APL. At the moment we require the Microsoft .NET bindings and can only do the testing from Microsoft Windows. The web server can be running anywhere, and we hope to add other client platforms in the future.

The results of this work are now available in the GitHub Repository Dyalog/Selenium. The following example, included in that repository, shows a simple test which verifies that the TryAPL website is able to execute a simple expression:

 ∇ r←Basic;S;result
 ⍝ Basic test that TryAPL is working - return error message if it isn't
 
 S←##.Selenium
 S.InitBrowser''
 S.GoTo'http://tryapl.org'
 
 'APLedit'S.SendKeys'1 2 3+4 5 6'
 S.('APLedit'SendKeys Keys.Return)
 result←'ClassName'S.Find'result'
 r←result S.WaitFor'5 7 9' '1 2 3+4 5 6 failed'
 ∇

MiServer Regression Testing

The primary motivation for this work has been to create regression test scripts for MiServer version 3.0. The MiServer regression testing mechanism is extremely simple (possibly a bit TOO simple, we’ll cross that bridge later): If a site contains a folder called “QA”, and the folders within mirror the structure of the web site, then a mechanism exists to load each page in turn and run the corresponding test function. You can read more about it on GitHub and see it working in the video at the top of this post.

News from Causeway – SharpLeaf (Alpha Preview Now Available)

For more than 20 years, Causeway has been developing APL tools to produce automated publication-quality graphics and typesetting. They differ from most modern technologies on mainly two points:

  • The API philosophy is to keep it simple and clean rather than complex and dirty, so that neat output can be generated with the bare minimum of coding
  • The implementation is a forward-going state machine, so that arbitrarily complex inclusions can be created instead of having the engine restricted by the object hierarchy

Following the emergence of the .NET platform in the 2000s, these products were fully refactored into a single package called SharpPlot; this is delivered both as a cross-platform APL workspace and as a stand-alone .NET assembly that can be used outside the APL world. The major benefit of doing this was that 20 years of patched-in functionality could be incorporated into a more consistent and better documented API (see http://www.sharpplot.com) – a side-effect is that the .NET assembly generally performs an order of magnitude faster than its APL counterpart.

SharpPlot, which has until now only comprised the chart generation engine (refactored RainPro product) now also includes SharpLeaf (refactored NewLeaf product).

Page from a sample report

Sample report page (click to enlarge)

The main features of SharpLeaf are:

  • Document Layout: a set of master pages defining paper size and rules for and color, boxes, images, fixed or parameterised text (for example, page number and date) etc.
  • Paragraph Styles (word processing): fine typesetting control over the text flow (font, alignment, spacing, indents, bullets, etc.)
  • Tables (spreadsheet processing): fine control over tabular presentation of data, including multi-page tables
  • Inclusions: text flow around objects such as images, charts, tables, dropped capitals or blank space

SharpPlot version 2.70 includes the first (alpha) version of SharpLeaf. SharpLeaf should be considered as being in its alpha stage (its API could change) with a GA release scheduled to be included with SharpPlot version 3.00 (due Q3 2015). Users are encouraged to try this alpha product and not only report any bugs but also provide feedback on the API and request enhancements. Please note that the SharpPlot engine is not expected to suffer any bugs with the addition of SharpLeaf as it is an independent product.

The alpha version can be requested by sending an email to support@dyalog.com

Isolated Mandelbrot Set Explorer

mandelbrot-equation

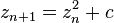
It amazes me that an equation so simple can produce images so beautiful and complex.  I was first introduced to the Mandelbrot set by the August 1985 issue of Scientific American. Wikipedia says “The Mandelbrot set is the set of complex numbers ‘c’ for which the sequence ( c , c² + c , (c²+c)² + c , ((c²+c)²+c)² + c , (((c²+c)²+c)²+c)² + c , …) does not approach infinity.” This means that in the images below, the areas in black are points in the Mandelbrot set and the other point colors are determined by how quickly that point “zooms” off towards infinity. The links above give a deeper discussion on the Mandelbrot set – for this post I’d like to focus on how I was able to speed my Mandelbrot set explorer up using isolates.

Mandelbrot Set
I find I learn things more easily through application than abstraction. In 2006 I wanted to learn more about the built-in GUI features of Dyalog for Windows and the application I chose was a Mandelbrot set explorer. While the basic algorithm for calculating a point in the Mandelbrot set is fairly simple, a 640×480 pixel image could involve over 75 million calculations. As new versions of Dyalog are released, I try to experiment with any applicable new features and possibly incorporate them into the explorer. For instance, when complex numbers were introduced in Dyalog, I modified the explorer to use them.

Dyalog v14.0 introduced a prototype of a parallel computing feature called isolates that may one day be integrated into the interpreter. Isolates behave much like namespaces except that they run in their own process with their own copy of the interpreter. Each process can run on a separate processor, greatly improving performance. You can even set up isolate servers on other machines.

Mandelbrot set calculations are ideal candidates for parallelization as:

  • they’re CPU intensive
  • each pixel can be calculated independently of others
  • there are no side effects and no state to maintain

The core calculation is shown below. It takes the real and imaginary parameters for the top left corner, the height and width of the image and the increment along each dimension and uses those parameters to build a set of co-ordinates, then iterates to see how quickly each co-ordinate “escapes” the Mandelbrot set.

 ∇ r←real buildset_core imaginary;height;i_incr;top;width;r_incr;left;set;coord;inds;cnt;escaped
  ⍝ Calculate new Mandelbrot set - remember using origin 0 (⎕IO←0)
  ⍝ real and imaginary are the parameters of the space to calculate
  ⍝       real            imaginary
  ⍝ [0]   width           height            of the image
  ⍝ [1]   increment size  increment size    along each axis
  ⍝ [2]   top             left              coordinates

   (height i_incr top)←imaginary            ⍝ split imaginary argument parameters
   (width r_incr left)←real                 ⍝ split real argument parameters
   set←coord←,(0J1×top+i_incr×⍳height)∘.+(left+r_incr×⍳width) ⍝ create all points in the image
   inds←⍳≢r←(≢coord)⍴0                      ⍝ initialize the result and create vector of indices
   :For cnt :In 1↓⍳256                      ⍝ loop up to 255 times (the size of our color palette)
       escaped←4<coord×+coord               ⍝ mark those that have escaped the Mandelbrot set
       r[escaped/inds]←cnt                  ⍝ set their index in the color palette
       (inds coord)←(~escaped)∘/¨inds coord ⍝ keep those that have not yet escaped
       :If 0∊⍴inds ⋄ :Leave ⋄ :EndIf        ⍝ anything left to do?
       coord←set[inds]+×⍨coord              ⍝ the core Mandelbrot computation... z←(z*2)+c
   :EndFor
   r←(height,width)⍴r                       ⍝ reshape to image size
 ∇

So, what’s involved in using isolates to parallelize the explorer?  As it turns out, not much! First I )COPYed the isolate namespace from the isolate workspace distributed with Dyalog v14.0. I wanted to be able to select the number of processors to use, so I added a line to my init function to query how many processors are available:

 processors←1111⌶⍬ ⍝ query number of processors

Next I wrote a small function to initialize isolates for as many processors as were selected (2 or more). Notice that when creating the isolates, I copy buildset_core (from above) into each one:

 ∇ init_isolates processors
  ⍝ called upon initialization, or whenever user changes number of processors to use
   f.isomsg.Visible←1    ⍝ turn form's "Isolates initializing" message on
   {}isolate.Reset''     ⍝ reset the isolates
   {}isolate.Config'processors'processors ⍝ set the number of processors
   :If processors>1      ⍝ if using more than one processor
       ⍝ create the isolates, populating each one with buildset_core
       isolates←isolate.New¨processors⍴⎕NS'buildset_core'
   :EndIf
   f.isomsg.Visible←0    ⍝ turn the form message off
 ∇

Finally, I wrote a routine to share the work between the selected number of processors and assemble the results back together.

 ∇ r←size buildset rect;top;bottom;left;right;width;height;vert;horz;rows;incr;imaginary;real
  ⍝ Build new Mandelbrot Set using isolates if specified
  ⍝ rect is the top, bottom, left, and right
  ⍝ size is the height and width of the image
   (top bottom left right)←rect
   (height width)←size
   vert←bottom-top                             ⍝ vertical dimension
   horz←right-left                             ⍝ horizontal dimension
   rows←processors{¯2-/⌈⍵,⍨(⍳⍺)×⍵÷⍺}height     ⍝ divide image among processors (height=+/rows)
   incr←vert÷height                            ⍝ vertical increment
   imaginary←↓rows,incr,⍪top+incrׯ1↓0,+\rows  ⍝ imaginary arguments to buildset_core
   real←width,(horz÷width),left                ⍝ real arguments to buildset_core
   :If processors=1                            ⍝ if not using isolates
       r←real buildset_core⊃imaginary          ⍝ build the image here
   :Else
       r←⊃⍪/(⊂real)isolates.buildset_core imaginary ⍝ otherwise let the isolates to it
   :EndIf
 ∇

The images below depicts what happens with 4 processors. Each processor builds a slice of the image and the main task assembles them together.
Drawing1

So, how much faster is it?  Did my 8 processor Intel Core i7 speed things up by a factor of 8? No, but depending on where in the Mandelbrot set you explore, the speed is generally increased by at least a factor of 2 and sometimes as high as 5 or 6. I thought about why this might be and have a couple of ideas…

  • There’s overhead to receive and assemble the results from each isolate.
  • The overall time will be the maximum of the individual times; if one slice is in an area that requires more iterations, then the main task needs to wait for those results, even if the other slices have already finished. I could possibly show this by updating the individual slices as they become available. Maybe next time 🙂

What impressed me was that I could speed up my application significantly with about 20 lines of code and maybe an hour’s effort – most of which was spent tinkering to learn isolates. You can download the Mandelbrot set explorer from my GitHub repository.